
Why Amazon Sales Estimates Are Hard, and What They Can Honestly Tell You
 Max VershininFounder of Arbitrage Hero
sales rankbsrsales estimateproduct researchonline arbitrage
Ask AI to summarize this article:





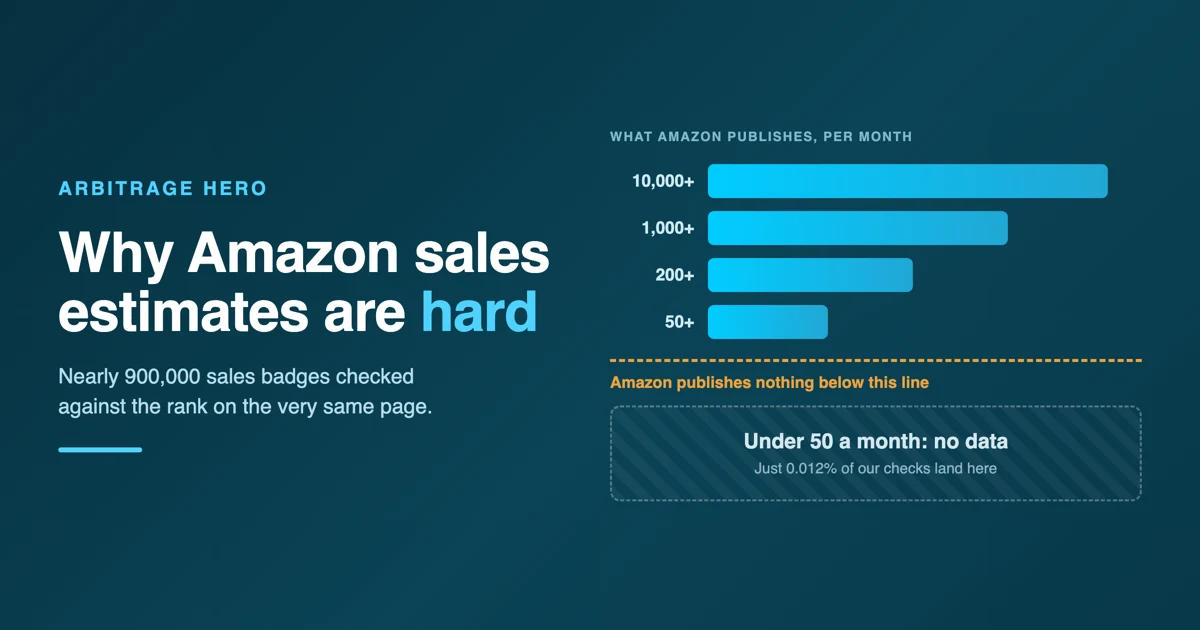
Short answer: Amazon never publishes how many units a product sells. The only public signal is the "bought in past month" badge, and it has four properties that limit every estimate built on it. It is a floor rather than a number, its steps are coarse, it starts at 50, and its window rolls. We checked nearly 900,000 of those badges against the sales rank shown on the same page at the same moment. An estimate built from rank lands within two times of the badge figure 73.5% of the time. Below 50 units a month it can say nothing at all.
Most articles about sales rank answer a different question. They tell you what a good BSR looks like in each category, which compares one rank to other ranks. That is useful, and it is not the number a sourcing decision needs. You need units per month, because that is what turns a margin into money and decides how long your cash is tied up.
This article is about the gap between those two things: why it exists, how wide it is, and what an estimate can honestly claim. The figures come from our own measurement, described below, rather than from general advice.
Velocity decides more than margin does
A return on investment figure without a sales speed attached is an incomplete number. It tells you what one unit earns. It does not tell you when, or whether.
Take an example. Two products both cost you $10 and both return 40%, so each unit earns $4. The first sells 200 units a month, the second sells 3. If you buy 20 of each, the first is gone in about three days and your $200 comes back with $80 on top, ready to spend again. The second takes most of a year to clear, and for that whole time your $200 is sitting in a warehouse instead of buying the next deal. Same ROI, and one of them is a business while the other is storage.
This is why the sales estimate sits underneath almost every other decision. It sets how many units to buy. It sets whether a 20% deal is better than a 60% deal. It decides which results are worth reading at all, because a filter on monthly sales is usually the first thing that cuts a scan of thousands of products down to a readable list. If that one number is wrong, everything built on top of it is wrong in the same direction, and the error is invisible.
It also carries the largest single risk in arbitrage, which is stock that does not move. A wrong margin costs you a few percent. A wrong velocity costs you the whole outlay for months, plus storage fees, and the money you could not put into something else. Amazon charges FBA storage monthly by the space your stock occupies, and its own guide to FBA fees advises focusing on products that sell quickly to cut storage time and the costs attached to it.
What Amazon actually lets you see
Amazon publishes two things that relate to sales, and neither is a sales figure.
The first is the Best Sellers Rank. Amazon's own guide to Best Sellers Rank states that it is calculated from sales volume, that recent sales count more than older sales, and that a product can hold a different rank in each category it sits in. What Amazon has never published is the conversion. There is no official table that turns rank 8,000 in Toys into a number of units, and no commitment that the relationship stays the same from one month to the next.
The second is the "X+ bought in past month" badge on the product page. This is the closest thing to ground truth that exists in public, and it is the only label anyone can train an estimate against. It has four properties that decide what is possible.
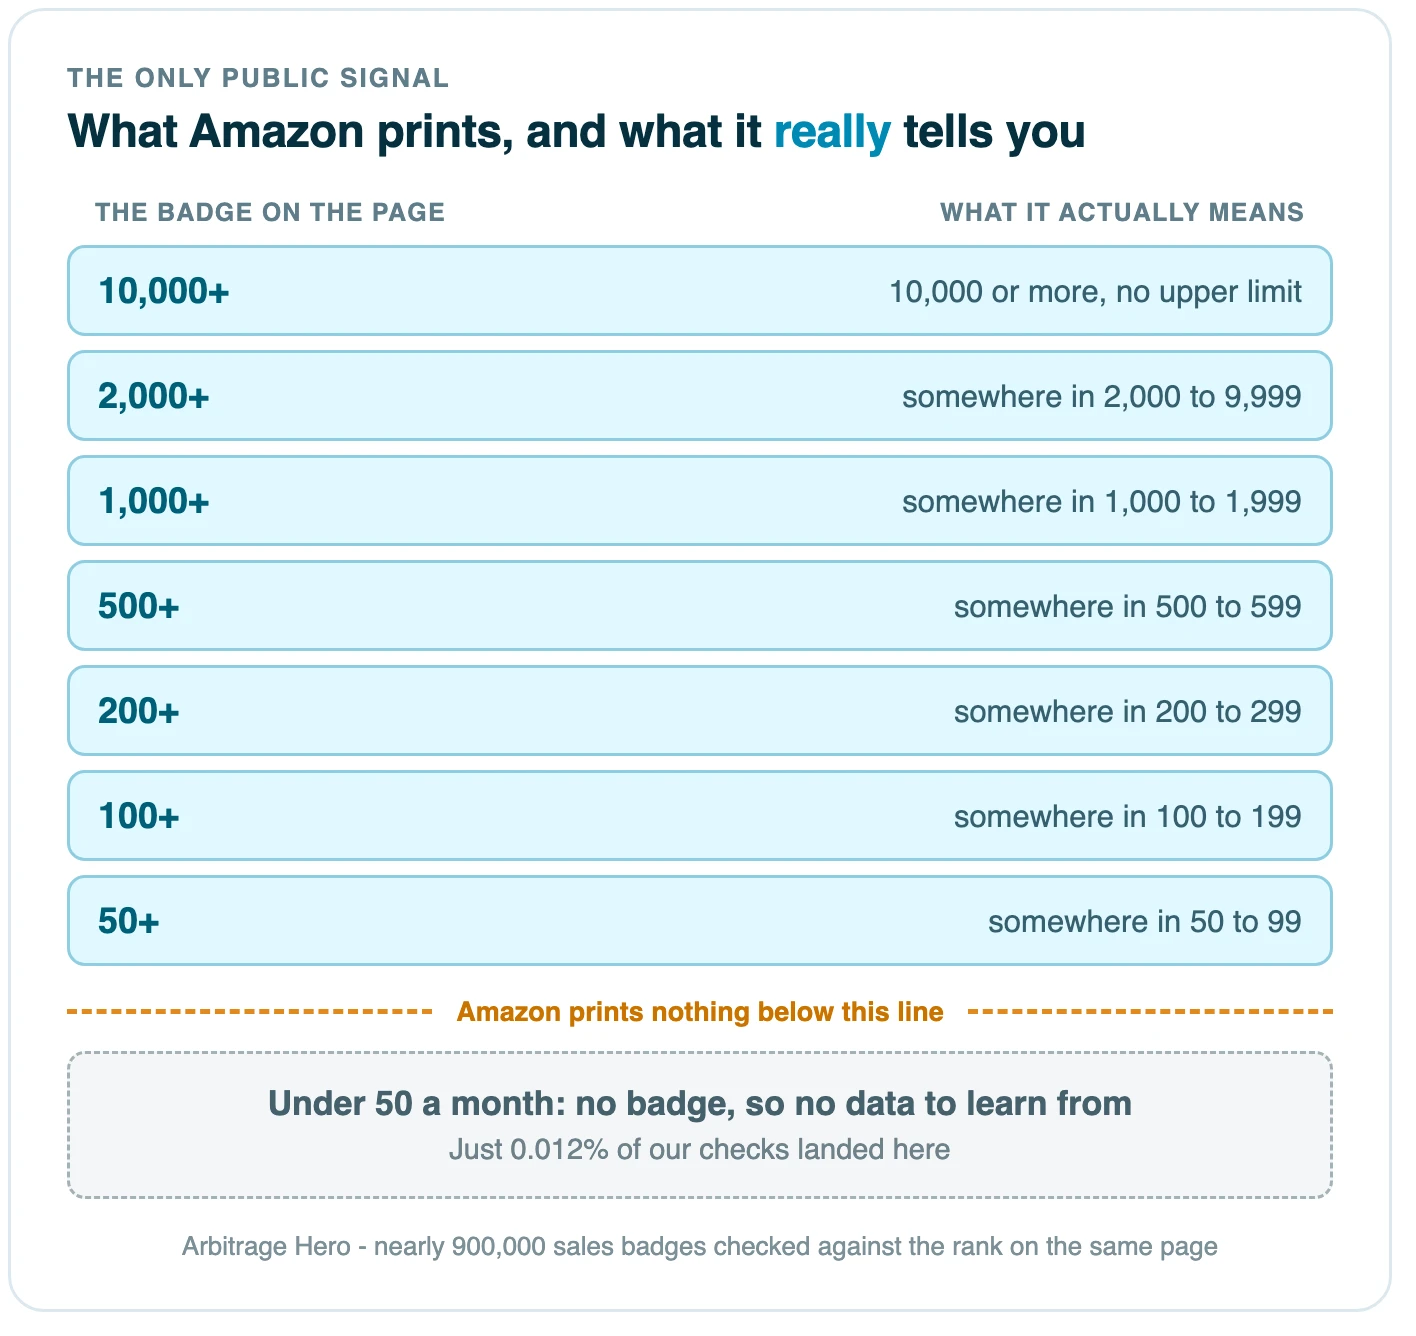
- It is a floor, not a measurement. A badge reading "100+" means the true figure is 100 or more. It is a range, not a number.
- The steps are coarse and uneven. The rungs we see are 50, 100, 200, 300, 400, 500, 600, 700, 800, 900, 1,000, 2,000 and 10,000. The gap between them grows as the numbers grow, so "2,000+" covers everything from 2,000 to 9,999.
- It starts at about 50. Below roughly 50 units a month Amazon almost never prints a badge at all, so almost nothing is published about slow sellers.
- The window rolls. Amazon does not document this, but across our own captures "past month" behaves as the last 30 days counted from the moment the page loaded, not a calendar month. On that reading, a badge seen on 12 March describes 10 February to 12 March.
Every sales estimate you have ever seen, from any tool, is built on top of those four properties. They are the ceiling on the whole category of software, ours included.
Nothing can be known below 50 units a month
This is the finding that matters most, and it is the one least often stated plainly.
Because Amazon prints no badge under 50, a dataset of badges contains almost no slow products. In that sample, fewer than one badge in eight thousand carried a figure below 50 a month: about 100 of them, or 0.012%. An estimate trained on this data has effectively never seen a product that sells slowly. It can learn the difference between 100 a month and 500 a month, because it has hundreds of thousands of examples of each. It cannot learn the difference between 10 and 30, because it has seen neither.
That is not a problem a better algorithm solves. It is missing information, and no amount of mathematics recovers a signal that was never recorded.
The practical consequence is direct. When a tool tells you a product sells "about 12 units a month", that figure is not a reading. It is an extrapolation past the edge of the available evidence, presented with the same confidence as a figure that sits in the middle of it. The number may be right. Nothing in the data can confirm it.
So the common beginner rule of "only buy products that sell at least 15 a month" asks a question that the public data cannot answer. It is a reasonable thing to want. It is not a thing anyone can currently measure.
How we measured this
Since June 2024, our Chrome extension has recorded, for every Amazon product page one of our customers opened, the sales rank on that page together with the sales badge on that page. Both numbers come from the same page at the same moment, which matters: a badge from March paired with today's rank is a wrong pairing, not a slightly noisy one.
That gives nearly 900,000 observations across almost 300,000 distinct products and 33 categories, collected between June 2024 and August 2026.
We then built the simplest estimate that could work, so the result reads as a floor rather than a best case. For each category, we sorted observations into bands by rank, took the middle observed sales figure in each band, and required the result to fall as rank gets worse. No machine learning and no libraries, just a lookup table.
It was trained on everything recorded before 1 May 2026 and then scored against the roughly 29,000 observations that came after that date. The split is by time and never at random, because a random split lets the same product appear on both sides and flatters the result. We also report separately how it did on products that appeared only after the cutoff, which is the honest number, since those contributed nothing to the training.
One limit of this method has to be stated before the numbers, because it changes how they should be read. The badge is a floor, so what we score against is the figure Amazon printed, not a verified unit count. When the table below says an estimate is within two times, it means within two times of that published figure. Nobody can currently do better on public data: every tool that reports an accuracy number is checking itself against the same badge.
| Measure | All test observations | Products never seen before |
|---|---|---|
| Observations scored | ~29,000 | ~11,000 |
| Within two times of the badge figure | 73.5% | 68.4% |
| Typical error | 1.7 times | 2 times |
| Correctly flags "sells 100+ a month" | 86.5% precise, 95.4% found | 81.6% precise, 94.8% found |
Read the second row as the summary. A simple rank-based estimate gets you inside a factor of two most of the time. It does not get you a unit count you can put in a spreadsheet and trust to the digit.
A rank means different things in different categories
Rank is a position in a queue, and the queue is a different length in every category. Before the accuracy figures, it helps to see how large that difference is. This is the sales rank reference table inside our own app, which lists the rank that marks the top slice of each US category.
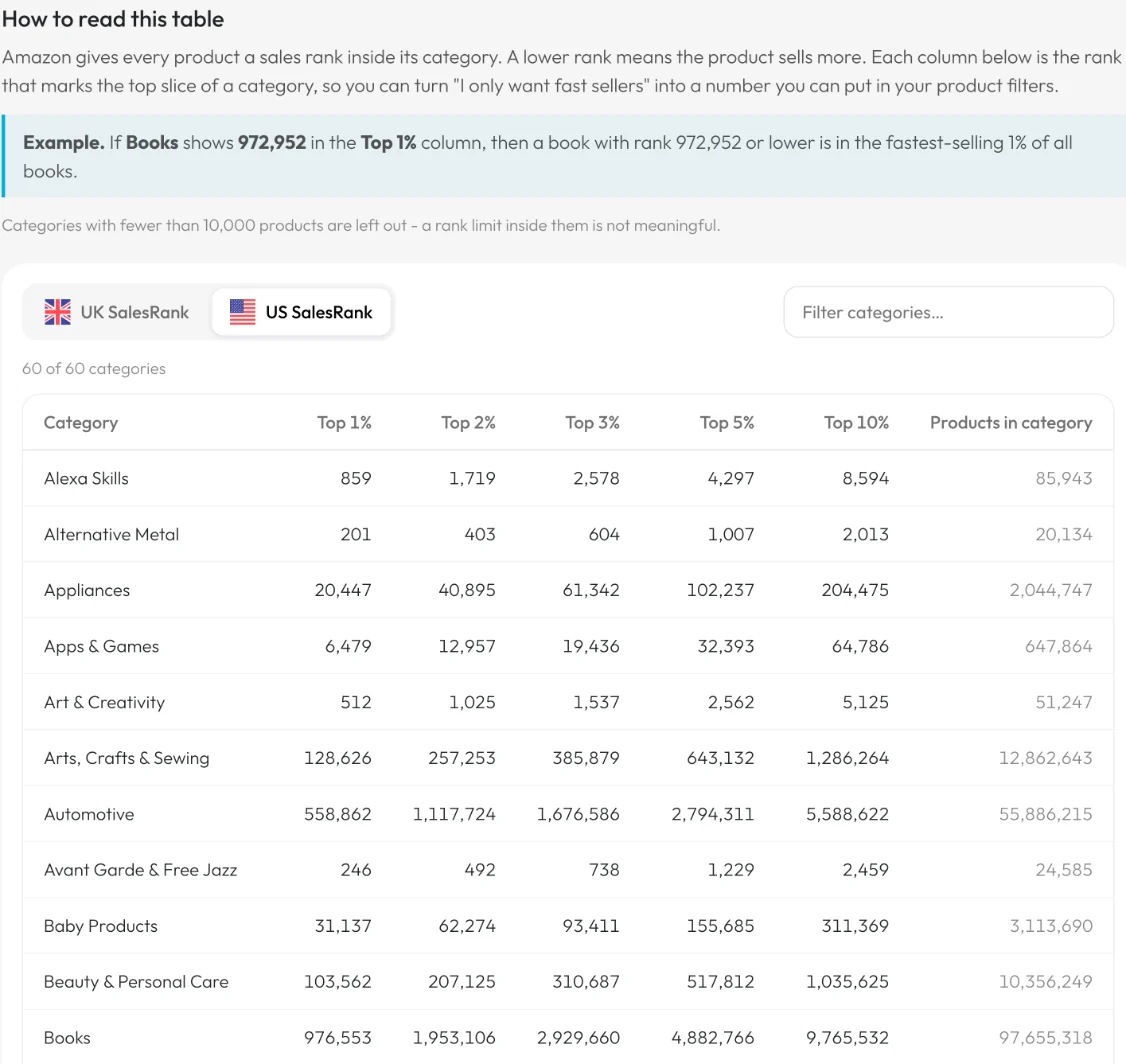
Take a single rank of 100,000 and read it across four of those categories. In Books, where the top 1% starts at a rank of about 980,000, that product is comfortably inside the fastest-selling 1%. In Electronics, where the top 1% starts at about 210,000, it is also inside the top 1%. In Appliances, where the top 1% starts at about 20,000, the same rank is only just inside the top 5%. And in Alternative Metal, a category holding roughly 20,000 products in total, rank 100,000 does not exist at all.
One number, four different meanings. That is before you ask how many units any of it represents. These thresholds also move as Amazon's catalogue grows, so they are a current picture rather than a constant.
Our measurement shows what that does to accuracy. An estimate in Toys is worth roughly twice as much as the same estimate in Electronics.
| Category | Observations scored | Within two times | Typical error |
|---|---|---|---|
| Toys and Games | ~2,400 | 85% | 1.25 times |
| Tools and Home Improvement | ~1,600 | 82.5% | 1.25 times |
| Pet Supplies | ~1,500 | 79.8% | 1.4 times |
| Health and Household | ~3,600 | 78.1% | 1.5 times |
| Beauty and Personal Care | ~5,200 | 76.2% | 1.5 times |
| Grocery and Gourmet Food | ~3,900 | 68.7% | 2 times |
| Clothing, Shoes and Jewelry | ~1,300 | 67.9% | 2 times |
| Home and Kitchen | ~1,300 | 56.8% | 2 times |
| Electronics | ~700 | 51% | 2 times |
In Electronics the estimate is inside a factor of two only about half the time, which is no better than chance. That is not a fixable weakness of one method. Electronics contains both a $6 cable and a $2,000 television in the same ranking, prices move constantly, and a rank there carries far less information about units than a rank in Toys does.
The useful habit is to hold the same estimate to a different standard depending on where the product sits. In Toys or Tools it is solid enough to size an order from, as long as you remember that about one estimate in six is still outside a factor of two. In Electronics or Home and Kitchen, use it only to sort candidates, not to decide quantities.
In December, the same rank in Toys means three times the sales
This one surprised us, and it is the reason a fixed rank-to-units chart goes wrong in Q4.
We took a fixed band of ranks, from 1,000 to 10,000, and asked what the middle product in that band actually sold, month by month, with all years pooled together.
| Category | January to November | December |
|---|---|---|
| Toys and Games | 900 to 1,000 units | 3,000 units |
| Beauty and Personal Care | 2,000 units | 2,000 units |
| Health and Household | 3,000 units | 3,000 units |
A toy holding rank 5,000 in December is selling around three times what a toy at rank 5,000 sells in June. In Beauty and in Health there is no monthly effect at all.
The point is where the seasonality lives. It is not in the product and it is not only in the rank. It is in what a rank means. In December everybody in Toys sells more, so holding the same position in the queue takes far more units. Any tool that maps rank to units with one fixed table, and does not vary it by month and by category, understates December in seasonal categories and would overstate January if you applied a December reading to it.
If you source for Q4, this is a direct warning. Reading a December rank against a January baseline will make a seasonal product look like an ordinary one.
Counting rank drops is not a substitute
The common workaround is to count how many times a product's rank dropped over the last 30 days, on the theory that each drop is a sale. We scored that method against the same test observations, and it fails in a specific and easily missed way.
| Method | How often it is right when it says yes | How much of the real thing it finds |
|---|---|---|
| Rank drops, used to spot "sells 50+ a month" | 100% | 59.2% |
| Rank drops, used to spot "sells 100+ a month" | 94.4% | 5.1% |
| Rank-based estimate, "sells 100+ a month" | 86.5% | 95.4% |
Read the second column and the third column together. Rank drops almost never call a slow product fast, which makes the method look excellent when you check the products it returns. The problem is everything it does not return. At its own bar, 41% of products that Amazon publicly says sell 50 or more a month are invisible to it, and at the 100 mark it finds only one in twenty.
This is the most expensive kind of error in sourcing, because it is silent. A filter that hides good products does not report anything. Your scan simply comes back shorter, everything in it checks out, and you never learn what was left behind.
What an honest sales estimate looks like
Given all of the above, a single number is the wrong way to show this, because it invents precision the underlying labels do not contain. An estimate is honest when it carries three things instead of one: the figure, the range around it, and where it came from.
The last one matters most. A badge Amazon actually printed is a fact. A figure computed from rank is a guess. Once those two are merged into one column called "monthly sales", nobody downstream can tell them apart again.
There is also a good argument for showing a speed class rather than a count. Nobody sources differently at 137 units a month than at 152, so the decision is really "fast enough for my money, or not". When we scored our estimate into three classes, fast at 200 or more, normal between 50 and 199, and slow under 50, it placed 81.8% of the test observations in the right class. That figure covers only the fast and normal classes. The slow class came back completely empty, with no test examples and no predictions, so it is not a three-class result and should not be read as one. It is exactly the gap described above showing itself, rather than hiding inside a plausible-looking number.
What to do with this
- Read every sales estimate as a range, not a figure. On our own measurement, roughly half to double the shown number is the honest band. Size your first order for the bottom of that range.
- Check the category before you lean on the number. In Toys, Tools, Pet Supplies and Health it is reasonably solid. In Electronics and Home and Kitchen, use it to sort candidates rather than to decide quantities.
- Distrust any specific figure below 50 a month. No public data supports it. If a filter for "sells at least 15 a month" matters to your buying, treat its output as unverified rather than as measured.
- Do not read a December rank with a January ruler in seasonal categories. In Toys the same rank means about three times the units, so a Q4 reading needs its own baseline.
- Use estimates to rank products against each other, not to pass a threshold. Deciding which of two products sells faster is a much easier question than deciding whether one clears exactly 100 a month, and the estimate is far more reliable at it.
- Treat rank drops as a confirming signal, never as the filter. When it says a product sells, believe it. When it says nothing, that is not evidence of a slow product.
- Prefer a real badge over any estimate when the product page shows one. It is coarse, but it is Amazon's own number rather than anyone's model.
Frequently asked questions
How accurate are Amazon sales estimator tools?
On our own measurement of nearly 900,000 rank and sales-badge pairs, a rank-based estimate landed within two times of the figure Amazon printed 73.5% of the time, and within two times 68.4% of the time for products it had never seen before. The typical miss was a factor of 1.7. Treat any estimator's single number as a range of roughly half to double, and expect it to be weaker in Electronics than in Toys.
Can you convert Amazon BSR into units sold?
Only approximately, and only per category. Amazon states that Best Sellers Rank is calculated from sales volume, but it has never published a conversion from rank to units, and no fixed chart holds. The relationship differs sharply between categories, and it also shifts by month: in Toys and Games, the same rank band corresponds to about three times as many units in December as it does the rest of the year.
What does "50+ bought in past month" actually mean on Amazon?
It means the product sold at least 50 units in the rolling 30 days ending when the page loaded, so the true figure sits somewhere between 50 and 99. The badge is a floor rather than a count, and the steps above it get wider as they rise, so "2,000+" covers everything from 2,000 to 9,999. Amazon shows no badge at all below roughly 50 units a month.
Why do two tools show different monthly sales for the same product?
Because neither is reading a real figure. Both are converting the same public rank using their own assumptions about what a rank means in that category, in that month. Small differences in those assumptions produce large differences in the output, especially in categories where rank carries little information about units. Disagreement between tools is a signal about the uncertainty, not proof that one of them is broken.
Can any tool tell me whether a product sells 15 units a month?
Not reliably, and not because the software is poor. Amazon publishes no sales badge under about 50 units a month, so there is almost no public evidence of what a slow-selling product looks like. In our data, fewer than one badge in eight thousand carried a figure below 50. Any tool naming a precise figure in that range is extrapolating beyond its evidence, whether or not it says so.
Keep reading
- 10 beginner mistakes in online arbitrage covers the other half of this problem: how BSR gets misread even when the estimate behind it is sound.
- How to choose replenishable products that sell consistently is the practical follow-on, because a product that sells steadily is worth more than one with a better single reading.
- Where Amazon arbitrage margins are thinnest measures the other axis on the same data. Category changes what a margin is worth as well as what a rank means.
- The Q4 online arbitrage guide is where the December finding above turns into a sourcing calendar.
- Which Amazon categories work for online arbitrage gives the category picture that decides how far to trust any of these numbers.